Sounds of the PhonD2 Corpus
Overview
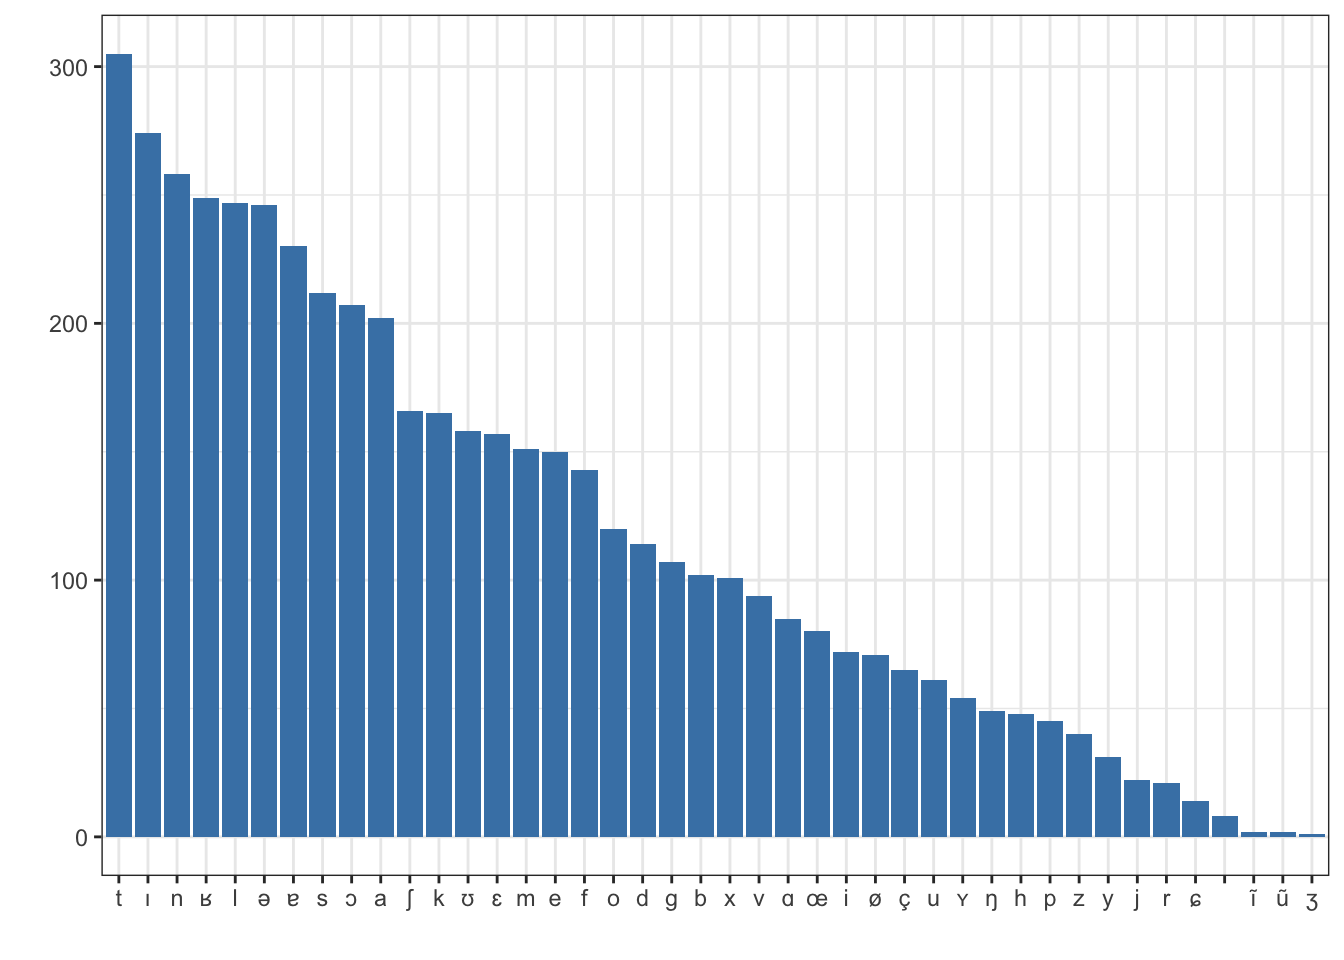
Information on sound frequency is provided by the following graph. Please note that the reported sounds are allophones of the corpus, not phonemes.
In addition, the following table presents the most frequent combinations of sounds in terms of tri-grams of the PhonD2 corpus.
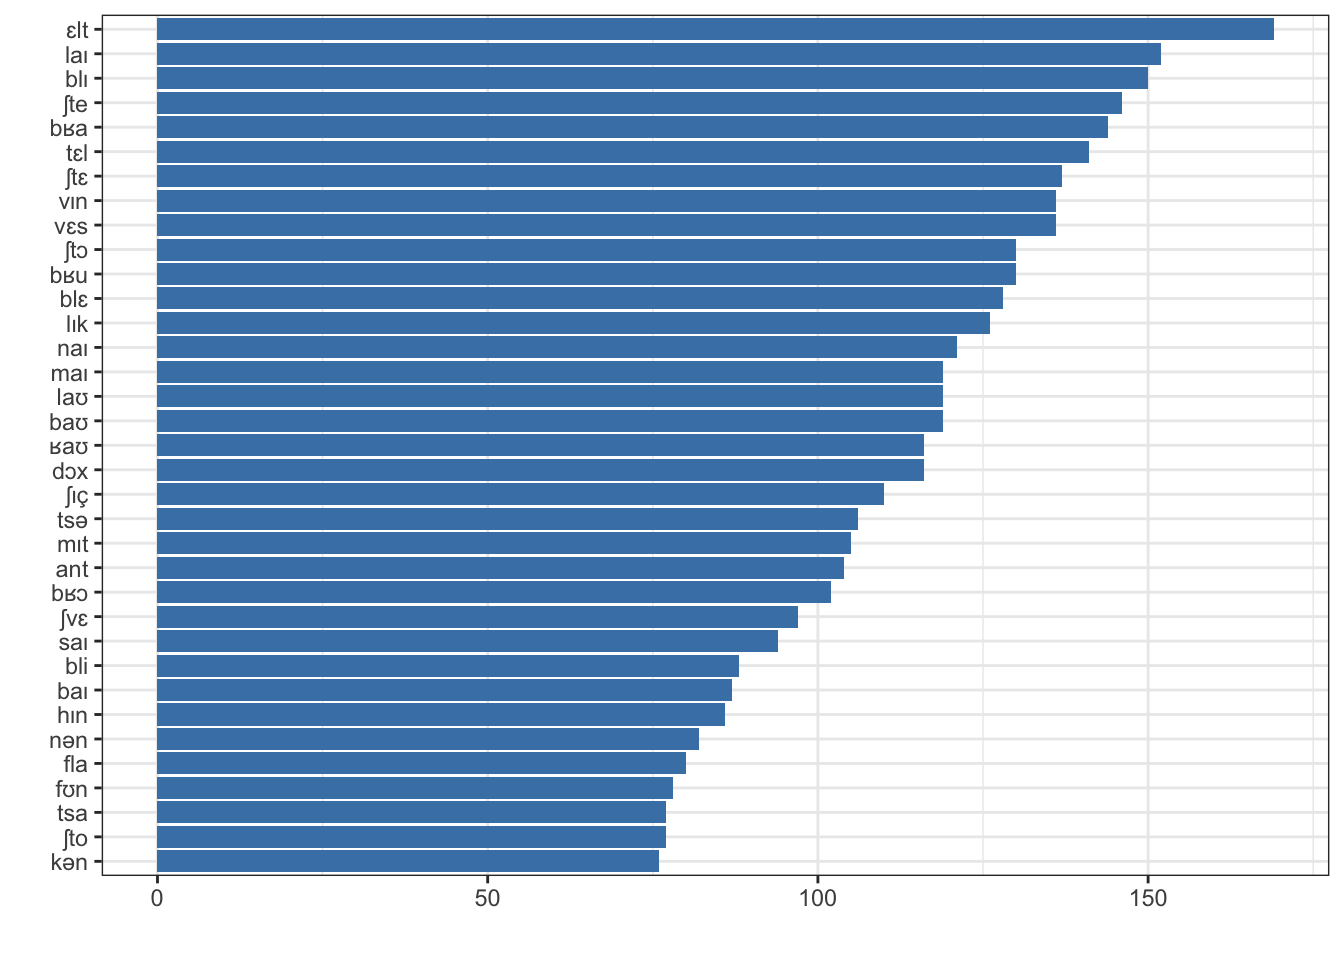
The vast majority of these combinations are due to lexemes (96 %). 51 % of them occur in monosyllables, 49 % in bisyllables, 51.
Tri-gram Table
The following table provides insights into the combination of sounds by presenting all 1643 tri-grams of the PhonD2 corpus (sounds in word initial or word final position as well as glottal stops are not reported). In order to ensure the easiest possible access to the tri-grams, the table is ordered following the core (i.e. the center position) of the tri-grams.
Clicking on the core sounds expands information on the particular combination of these sounds. The barplot shows the relation of the specific value to the maximum value of the distribution (in %; see the table above).
If wanted, sounds can be copied from the following list into the search box. In this way, all tri-gram positions can be scanned.
## t ə s ɔ ŋ ɑ ɪ ʁ ũ n a ʒ ĩ e ʏ ʊ ʃ ɐ k ɛ x ɡ ç ɕ f l b m v œ ø y z d o u i p r j h

PhonD2 | 2021
Licensed under a Creative Common Attribution 4.0 International (CC BY 4.0)
Provided by
![]()

![]()